Operating calendar
Hours, days, months, utilisation, downtime and ramp-up determine saleable tonnes—not nameplate capacity alone.

We build from operating drivers upward, then test the statements, debt schedule and return metrics for internal consistency and downside resilience.

Hours, days, months, utilisation, downtime and ramp-up determine saleable tonnes—not nameplate capacity alone.
Incoming quantity, moisture, process loss and yield link feedstock procurement to finished product output.
Product specification, rate convention, escalation and sales mix determine realised revenue assumptions.
Inventory build, receivables, supplier credit and seasonal stocking influence cash requirements before profit is realised.
Promoter contribution, term debt, moratorium, principal and CC utilisation are modelled separately.
Profit, cash and balance-sheet movement reconcile so one attractive metric cannot hide a broken schedule elsewhere.
IRR or NPV alone does not tell the promoter which operational variable deserves management attention. The model is used to locate the conditions that materially change viability.
Measure the margin and working-capital effect of raw-material price or transport escalation.
See how delayed volume affects fixed-cost absorption, debt service and cash generation.
Identify the price and contribution threshold needed to meet the promoter’s financing constraints.

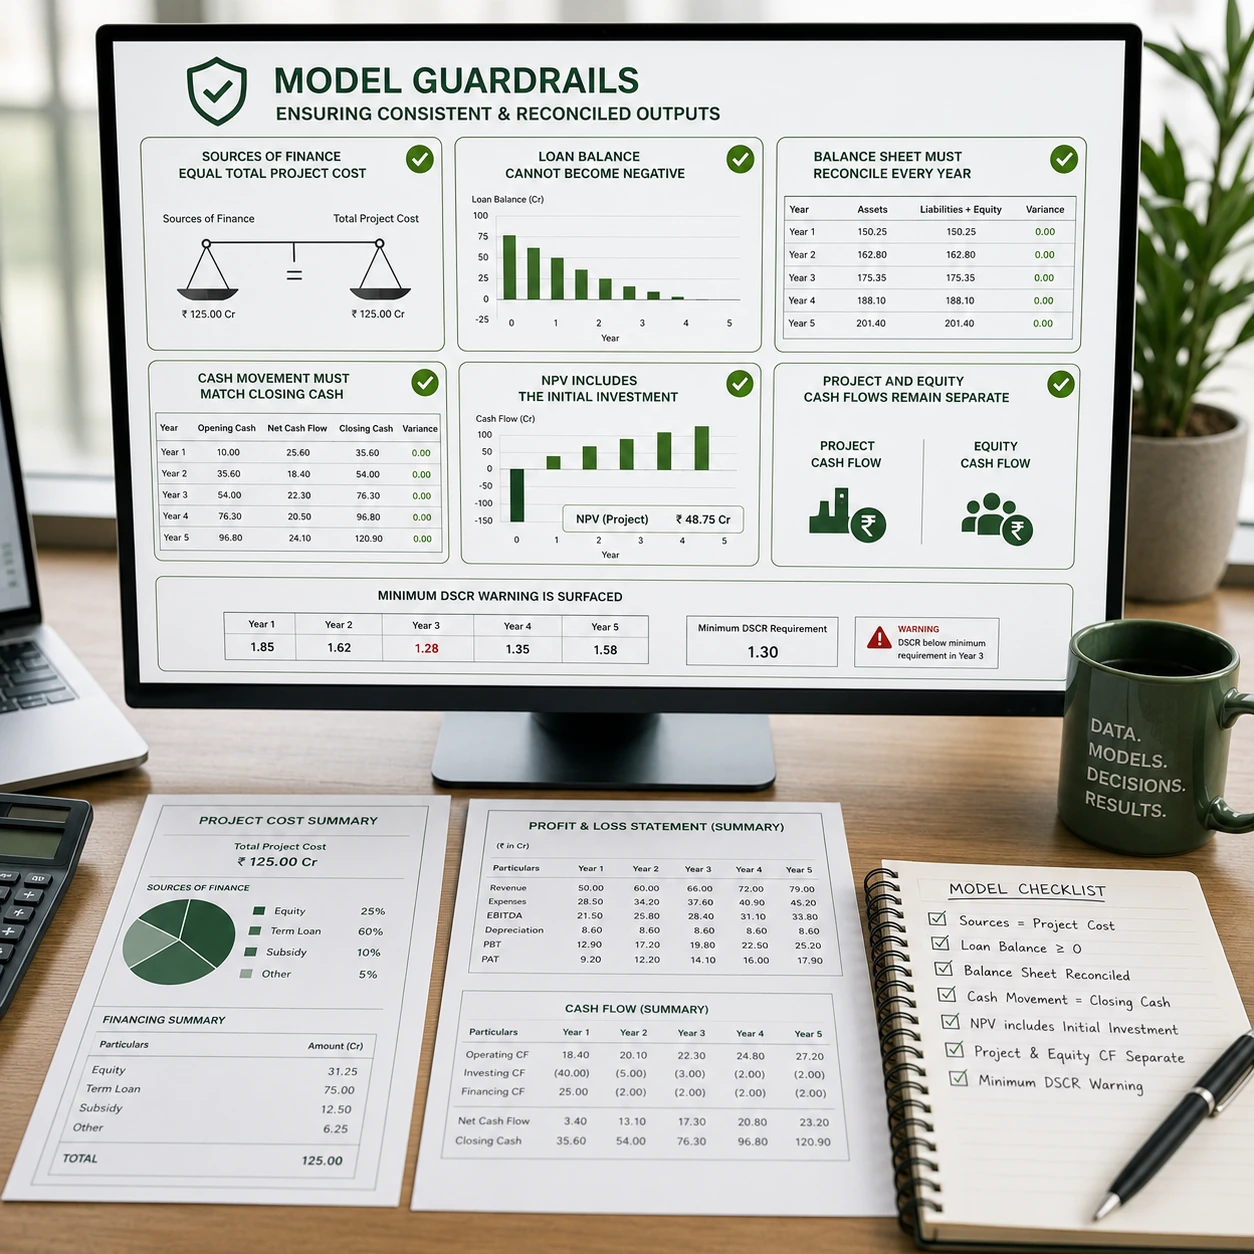
How much fixed investment and working capital the project really needs.
Project IRR, equity IRR and NPV calculated from the correct cash-flow perspective.
Whether projected cash generation supports the proposed repayment structure.
The utilisation, price or raw-material movement that turns a comfortable case into a weak one.
Share the available cost, capacity, price and feedstock assumptions for a model review.